The blog talks all about Chrome Dev tools and making its best use in Web Security Assessments and Bug Bounties
Debug function
It is used to create breakpoints for the function we specify under certain conditions
In the below example, I have specified a function postMessage following a condition where if the postMessage is using * as the target origin which in general, not a good practice as it could potentially leak sensitive information to third parties.
debug(postMessage, 'arguments[1] == "*"')
To use debug function, open chrome developer tools
Under Console, type
debug(postMessage, 'arguments[1] == "*"')
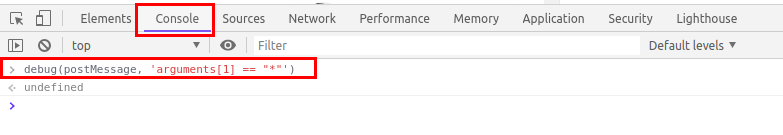
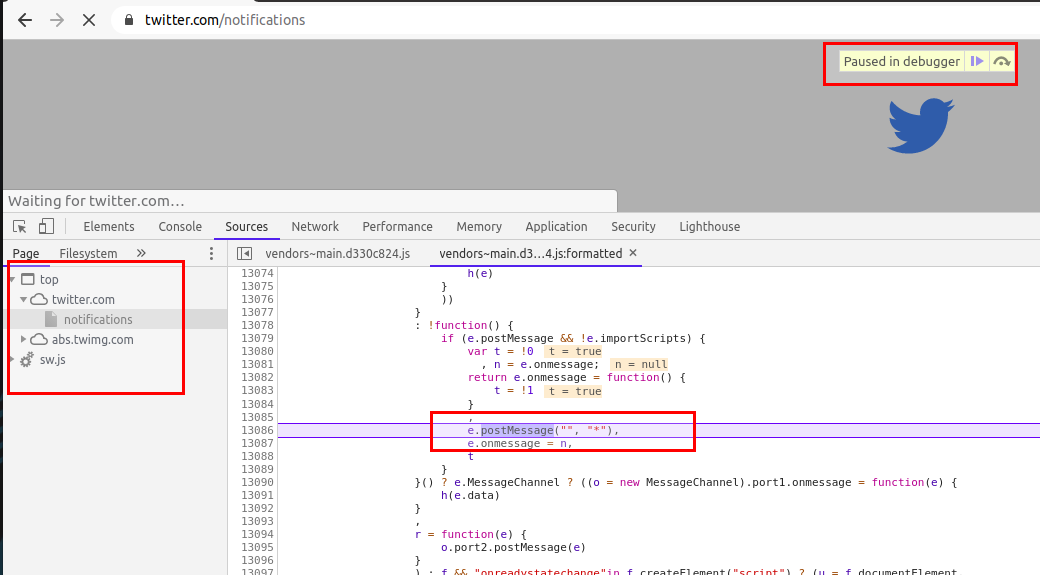
Reload the page and you will see your browser in action setting breakpoints whereever our function's condition is satisfied.
Another similar thing is monitorEvents, it creates breakpoints for DOM events and hence we can use monitorEvents function too to look for postMessage events.
To use monitorEvents, open chrome developer tools
Under Console, type
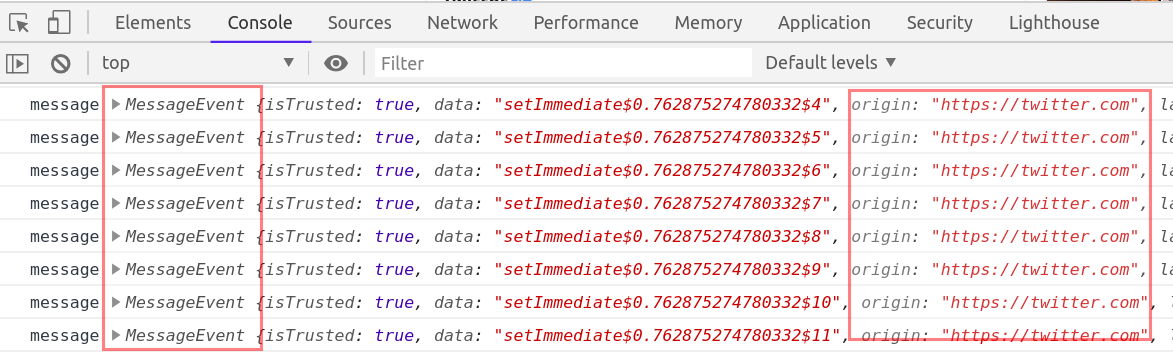
monitorEvents(window, 'message')
and refresh the page or click on any hyperlink/feature in the application to check for any MessageEvent
About postMessage API -- [Additional information]
If you do not know about postMessage API, then below points will give enough idea about what is postMessage API
The postMessage API is an alternative to JSONP, XHR with CORS headers and other methods enabling sending data between origins. It was introduced with HTML5 and like many other cross-document features it can be a source of client-side vulnerabilities
How it works
To send a message, an application simply calls the "postMessage" function on the target window it would like to send the message to:
targetWindow.postMessage("hello other document!", "*");
And to receive a message, a “message” event handler can be registered on the receiving end:
window.addEventListener("message", function(message){console.log(message.data)});
What can go wrong, if postMessage function not used properly
Scenario 1 The first pitfall lies in the second argument of the “postMessage” function. This argument specifies which origin is allowed to receive the message. Using the wildcard “*” means that any origin is allowed to receive the message.
Since the target window is located at a different origin, there is no way for the sender window to know if the target window is at the target origin when sending the message. If the target window has been navigated to another origin, the other origin would receive the data.
Scenario 2 The second pitfall lies on the receiving end. Since the listener listens for any message, an attacker could trick the application by sending a message from the attacker’s origin, which would make the receiver think it received the message from the sender’s window. To avoid this, the receiver must validate the origin of the message with the “message.origin” attribute.
If regex is used to validate the origin, it’s important to escape the “.” character, since this code:
    //Listener on http://www.examplereceiver.com/
    window.addEventListener("message", function(message){
        if(/^http://www.examplesender.com$/.test(message.origin)){
            console.log(message.data);
        }
    });
Would not only allow messages from www.examplesender.com, but also wwwaexamplesender.com, wwwbexamplesender.com etc.
Memory Function/Feature
The memory tab in the developer tools has been very useful to me in my security assessments. Before digging deep let's understand what memory tab does
Memory Tab -- [Additional information]
Memory tab helps to learn about the execution time and memory usage of the whole web page loaded in your browser. Memory tab has three profiling types
- Heap snapshot
- Allocation instrumentation on timeline
- Allocation sampling
For our requirement, the Heap snapshot profile is enough and we can ignore the other two.
Heap snapshot can take a snapshot of the memory heap to show the memory distribution of JavaScript objects and related DOM nodes in our loaded webpage. The most interesting thing about this is that the snapshot contains all the possible strings in your websites.
How it can help in security assessments
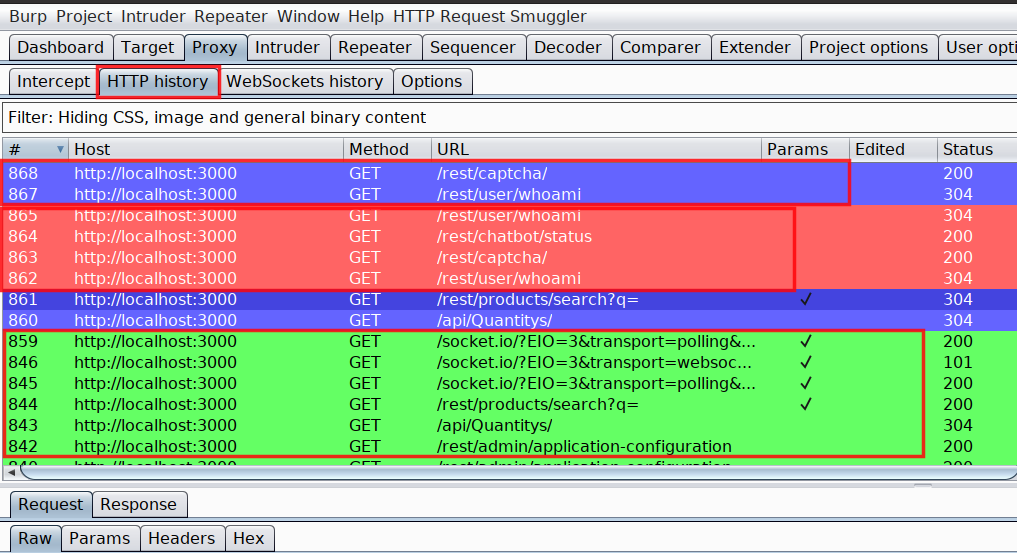
We can use the snapshot and can search for all possible APIs in the loaded web page.
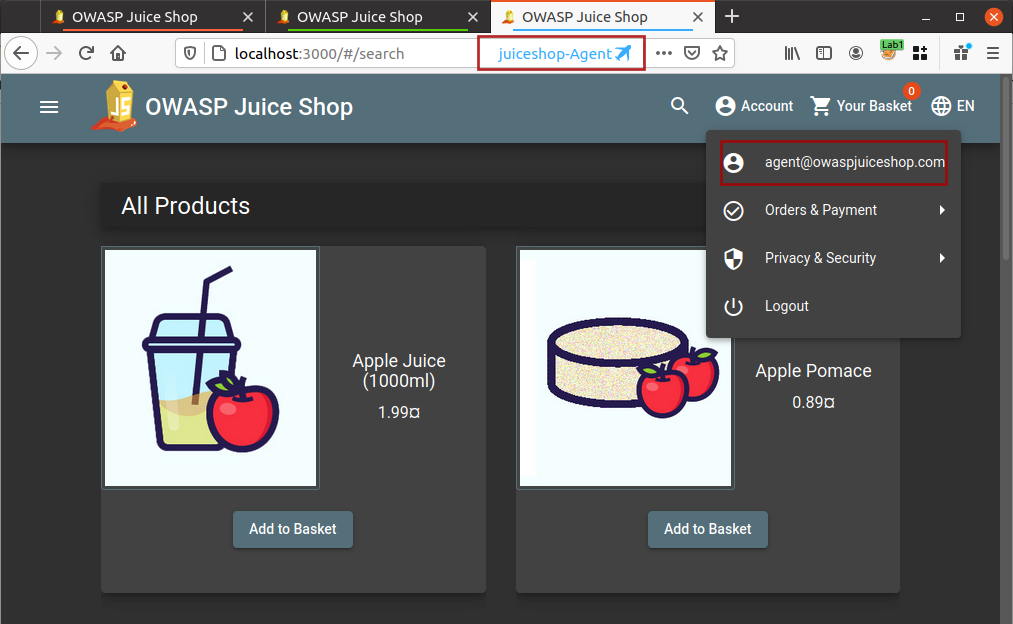
For example, I am using OWASP Juice Shop and will look for possible APIs in the application.
Taking Snapshot
Before taking the snapshot you must know that it is highly possible that the loaded page may not have all the APIs available in the application, hence you might need to take multiple snapshots by browsing multiple pages.
Steps
-
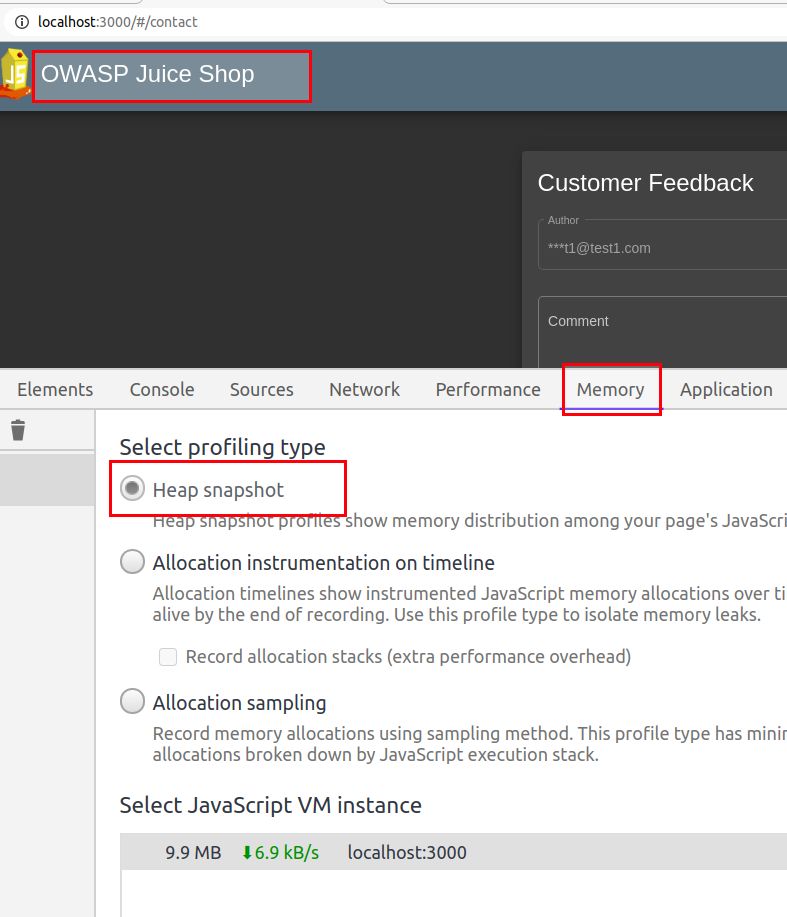
Load your application into chrome and open developer tools (F12)
-
Navigate to Memory tab
-
Select
Heap snapshotand click Take Snapshot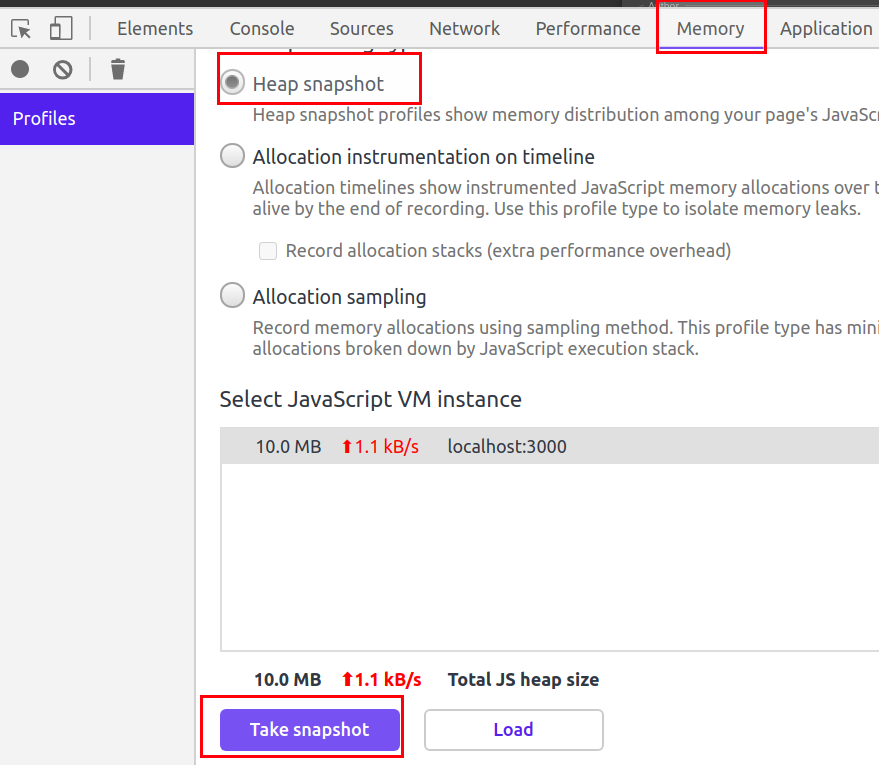
-
Once the snapshot is completed, press
ctrl+fto open search bar -
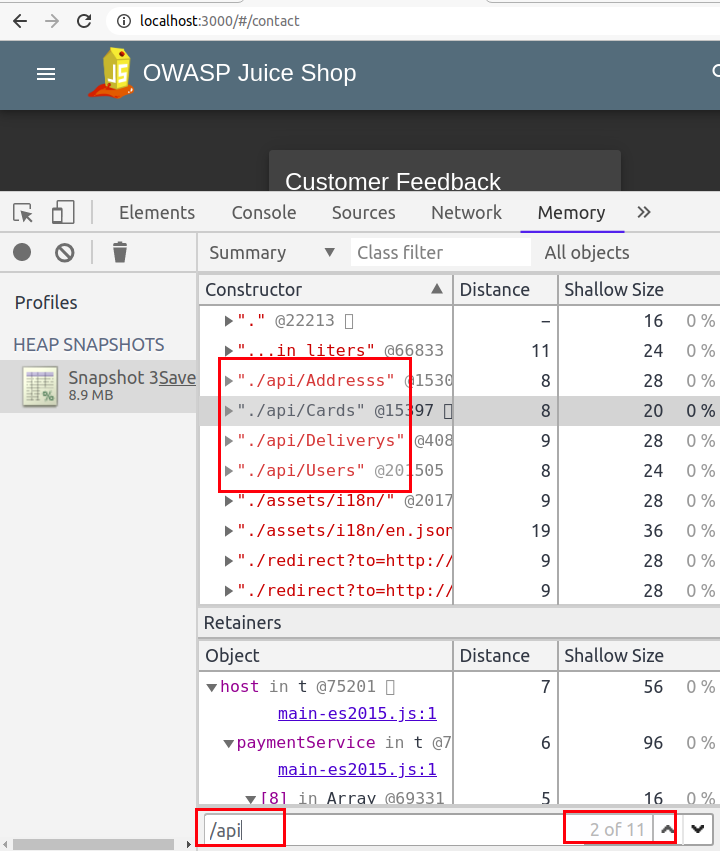
Now to search for APIs, search strings like
/apior/rest.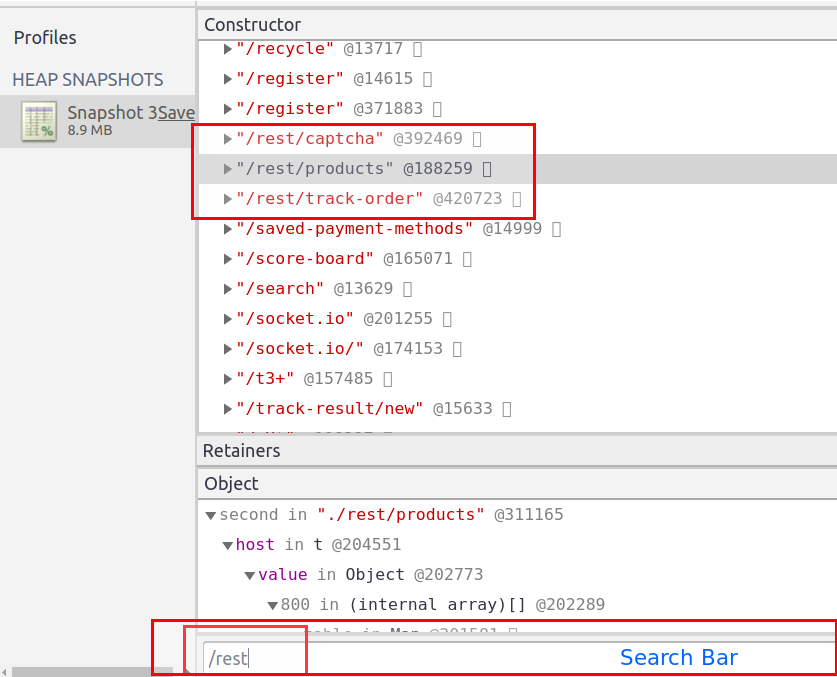
Apart from looking for APIs, we can also use it to look for specific strings in JavaScript code. Most of the time, we end up looking for secrets in JavaScript by first collecting the JavaScript files and then looking for hardcoded secrets. It becomes really annoying to load large JavaScript files and search for string. If this method does not help you in finding sensitive keywords, then you can read my blog Finding Gems in JavaScript using Dumpster DiverLink.
Lighthouse
An open-source tool built to improve the quality of the web pages. You can run it against any web page, public, or requiring authentication. It has audits for performance, accessibility, progressive web apps, SEO and more - This is what lighthouse is actually built for, but how is it helpful in our security assessments
Lighthouse has multiple categories based on which it does audit, the categories are mentioned below
- Performance
- Progressive Web App
- Best Practices
- Accessibility
- SEO
For our security assessments, Best Practices is the one which is required.
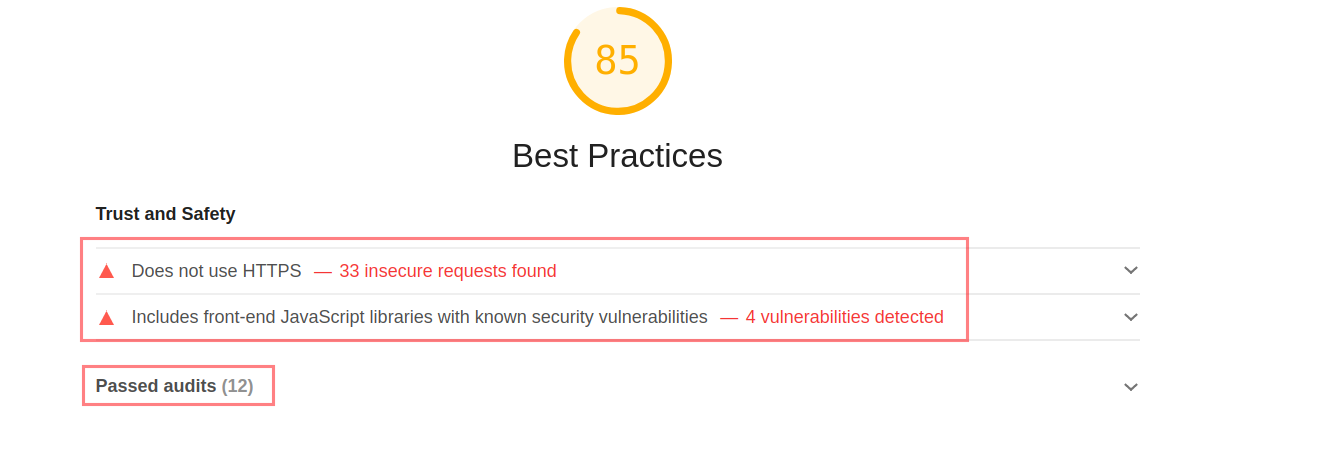
Best Practices: During audit, Lighthouse does below mentioned checks
- If the application does not use HTTPS Click Me
- links to cross-origin destinations are unsafe Click Me
- Includes front-end JavaScript libraries with known security vulnerabilities Click Me
- Uses Application Cache Click Me
- Uses deprecated APIs Click Me
- Listing all the front-end JavaScript libraries Click Me
Note: Use the click me hyperlinks to read more about the checks mentioned above.
For me this tool saves a lot of time, it becomes really annoying to individually look for basic security issues like not using HTTPS, outdated libraries, use of deprecated APIs, etc.
If you are a Burp Suite fan and thinking about Burp Suite doing this same thing under Issues, I would say yes it does; but lighthouse still beats Burp Suite as it reduces the steps and the UI is really awesome and user friendly.
Have a look how Burp Suite displays the issues
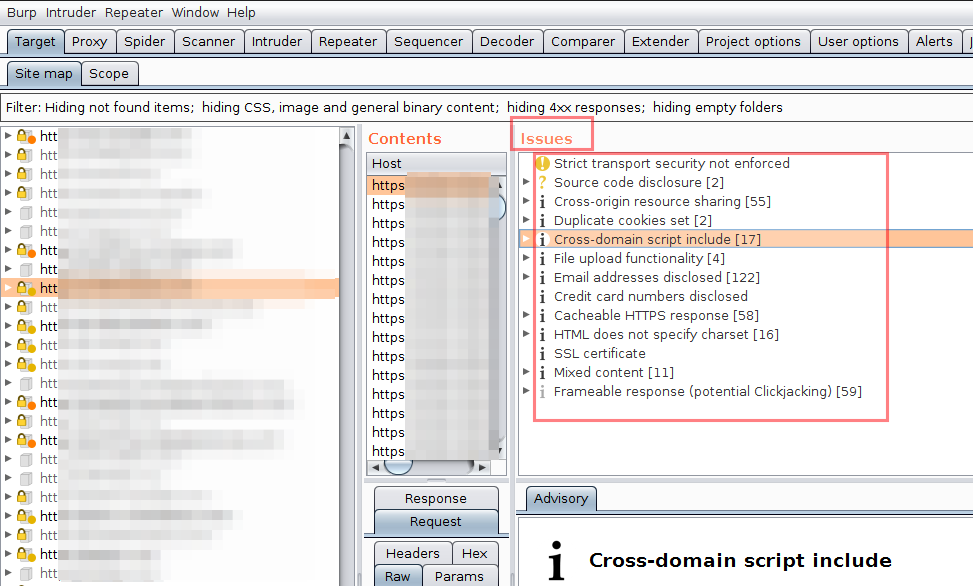
and now look at Lighthouse doing the same thing
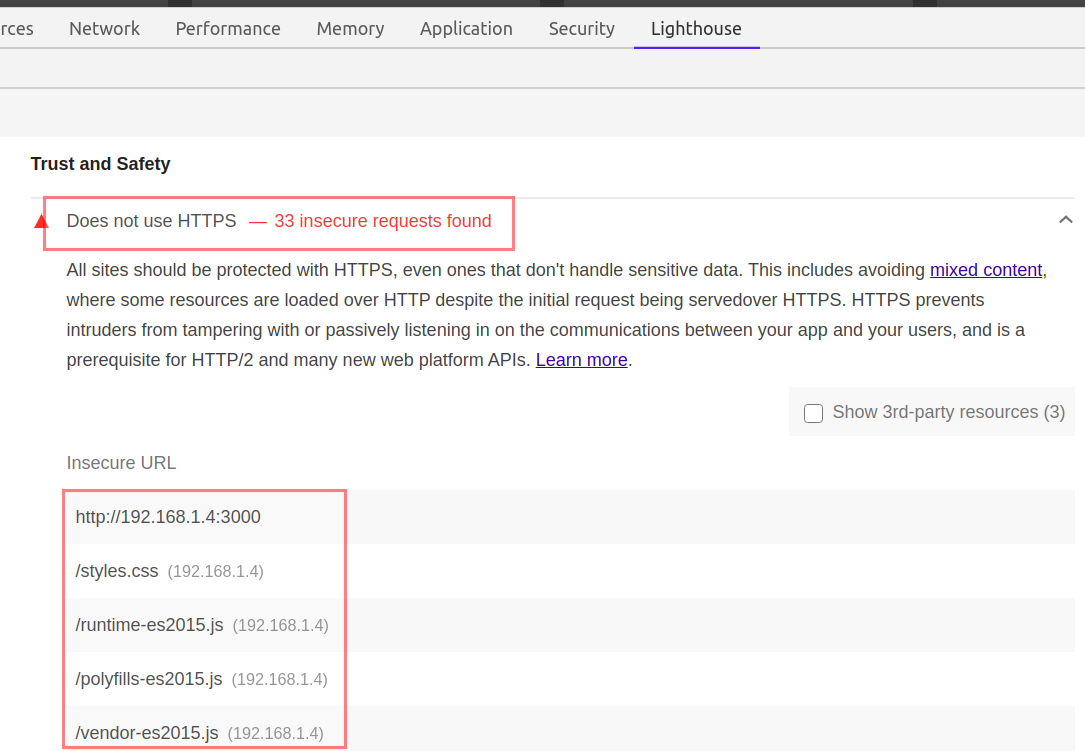
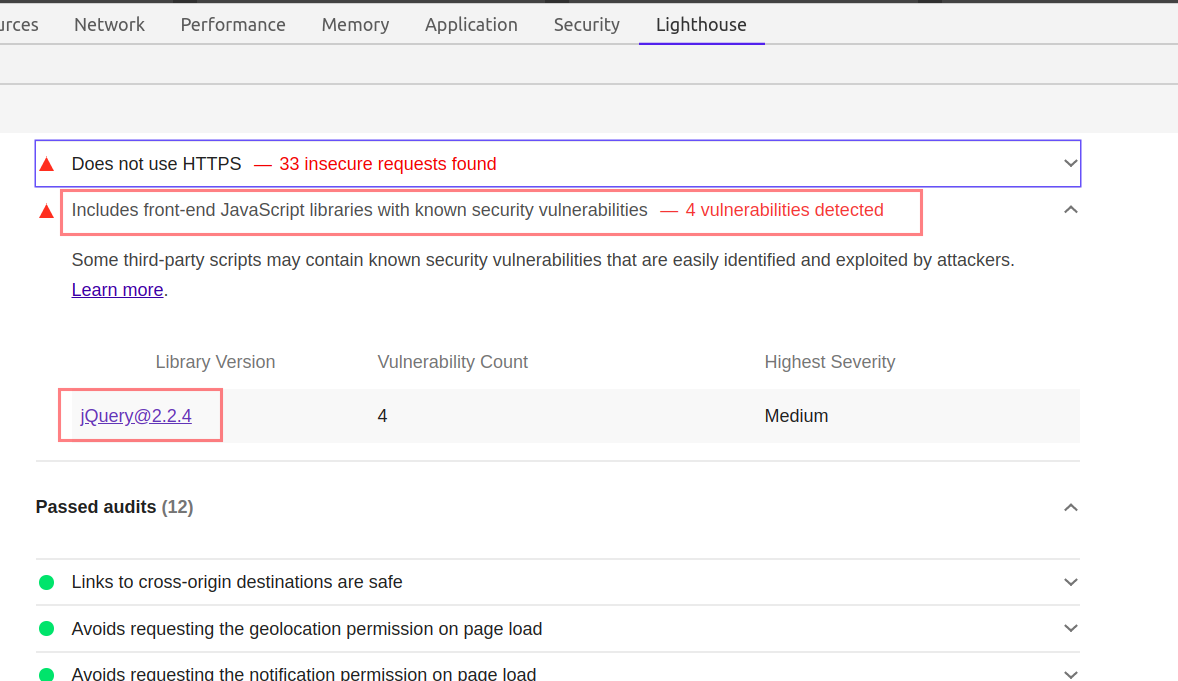
You just need to click on the Insecure URLs, or the mentioned libraries. Lighthouse will provide all the additional information you may look for.
Using Lighthouse in security assessment of OWASP Juice Shop application
Steps
-
Open OWASP juice in the Chrome Web Browser
-
Open Chrome Developers tools
-
Navigate to
Lighthousetab -
Uncheck all the categories except
Best Practicesand because we are onDesktopdevice, chooseDesktop.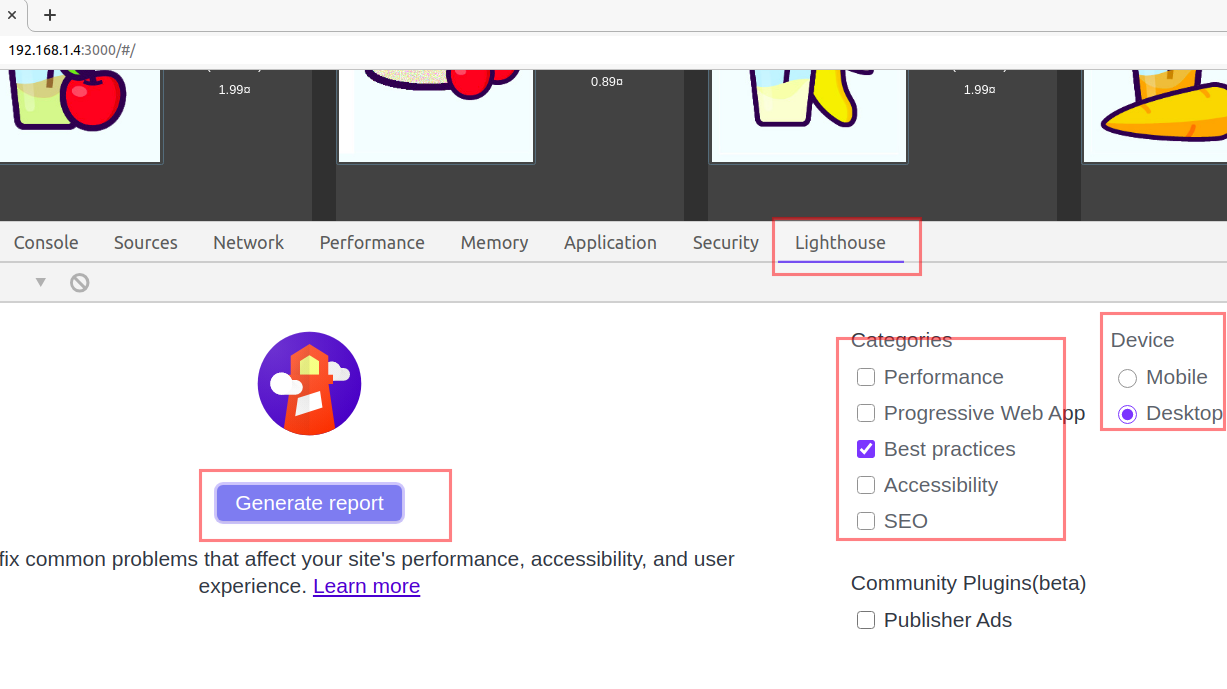
-
Click, Generate report button.
-
Wait for the Audit to finish and notice the report in response.
Network Tab
The network tab is another useful element in security assessment, although a lot of things can be done using the network tab, I will mention a few important ones.
Network tab helps us in identifying the kind of resources, pages being used by the application. We can filter the resources using the filter tab.
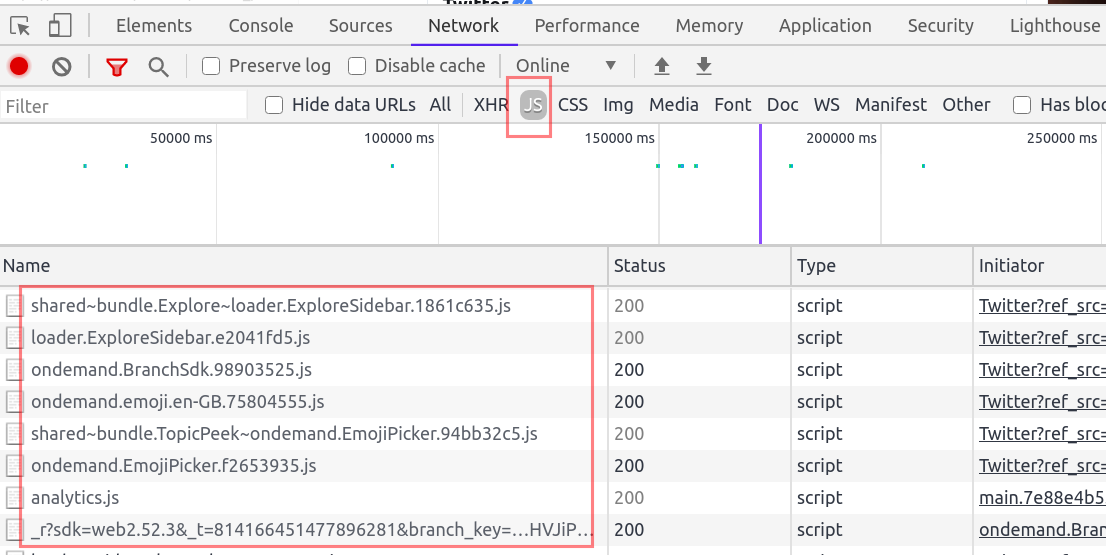
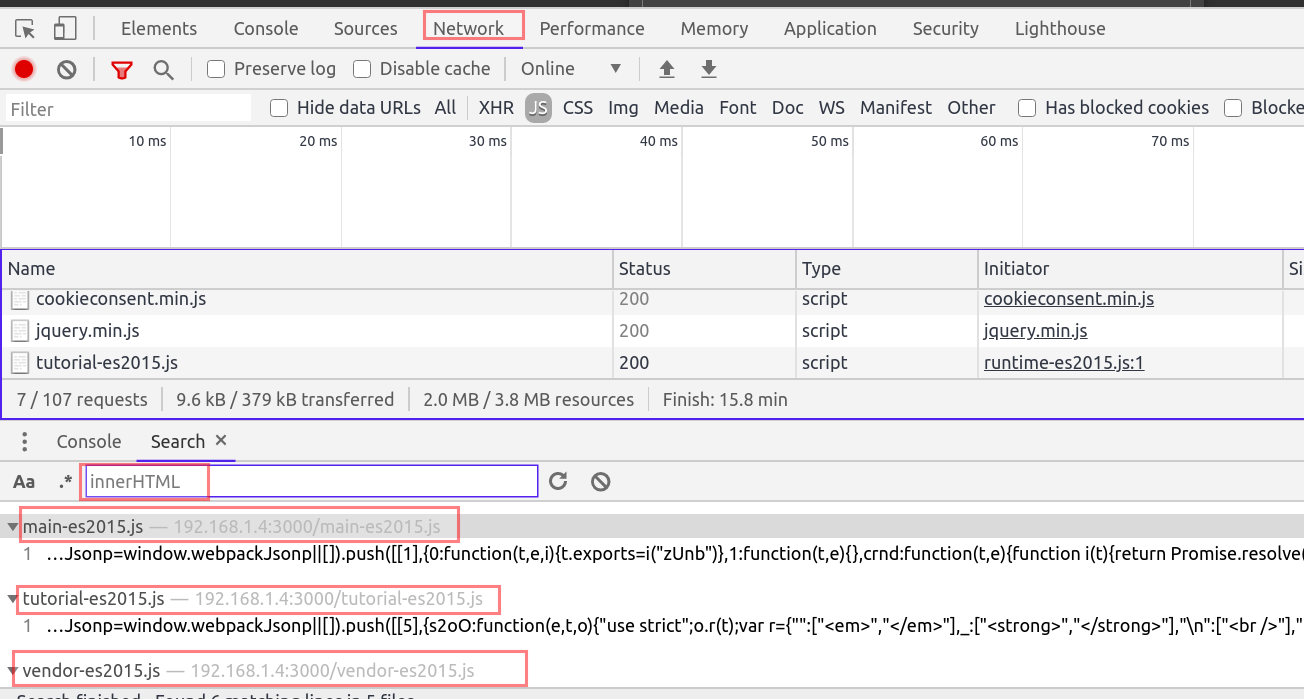
We can use the Network filter tab to identify all the JavaScript files by choosing JS. You can also use ctrl+shift+f to open the search bar and search for all possible resources loaded in the webpage.
For example search for DOM sinks like innerHTML.
I understand reading such a long blog takes time to process and that is why I am ending the blog here. I have few other things which I will be writing sometime soon till then read Healthy, eat healthily and stay healthy.
-------Thank you for reading--------
References
- https://developers.google.com/web/ilt/pwa/lab-auditing-with-lighthouse
- https://developer.mozilla.org/en-US/docs/Web/API/MessageEvent
- https://developers.google.com/web/updates/2015/05/quickly-monitor-events-from-the-console-panel
- https://www.youtube.com/watch?v=Y1S5s3FmFsI
- https://labs.detectify.com/2016/12/08/the-pitfalls-of-postmessage/